(photo credit above to wellness_ted on Instagram providing some humor on fitness influencers)
Strava Influencing
I use Strava to track my fitness (cycling, running, etc.) and for motivation by following friends and family. But I noticed my Activity feed has started becoming more similar to Instagram with photos, custom color maps, weather info, etc. In fact videos for rides were just added as a feature for Strava users in June of 2022.
This got me wondering, will more “influencers” use Strava to build their personal brand? And how might they maximize their engagement with their followers?
The Challenge: How can you maximize engagement with followers on Strava?
TLDR: Using 1400+ rides w/ a combined 3800 kudos an ML model was developed to predict how many of your followers will give kudos on your next ride with 4 simple inputs. You can try it out on www.stravasnooper.com.
Read on for insights learned from my data like how far to ride for maximum kudos along with how I got 27 kudos, the most kudos of my 9 year Strava career.
Table of Contents
Measuring Engagement: Kudos & Comments
On Strava there are currently two primary ways for users to interact with one another, kudos & comments. Kudos are the simplest “like” style where as people comment on activities and can tag people etc.
To demonstrate your followers engage with you it’s simplest to measure the number of kudos your activities receive. Comments are “high engagement” in that somebody has taken the time to type something out rather than just click the kudo button.
To break the original challenge into “bite-sized” chunks lets focus on adjusting the original challenge to:
Maximize engagement with followers measured by getting more kudos
The Idea: If we can learn which activity traits get more kudos (distance, time etc.). Then hopefully there’s “low-hanging fruit” insights that don’t require 200km rides every day to get kudos!
First: Why Do People Give Kudos?
When/where in Strava do you give kudos? The simplest is right on your Activity Feed. Presented with your followers recent activities you can see basic information for every single activity. Unless you click in and look at the details, that’s what you have to go off and decide “will I give kudos?”.
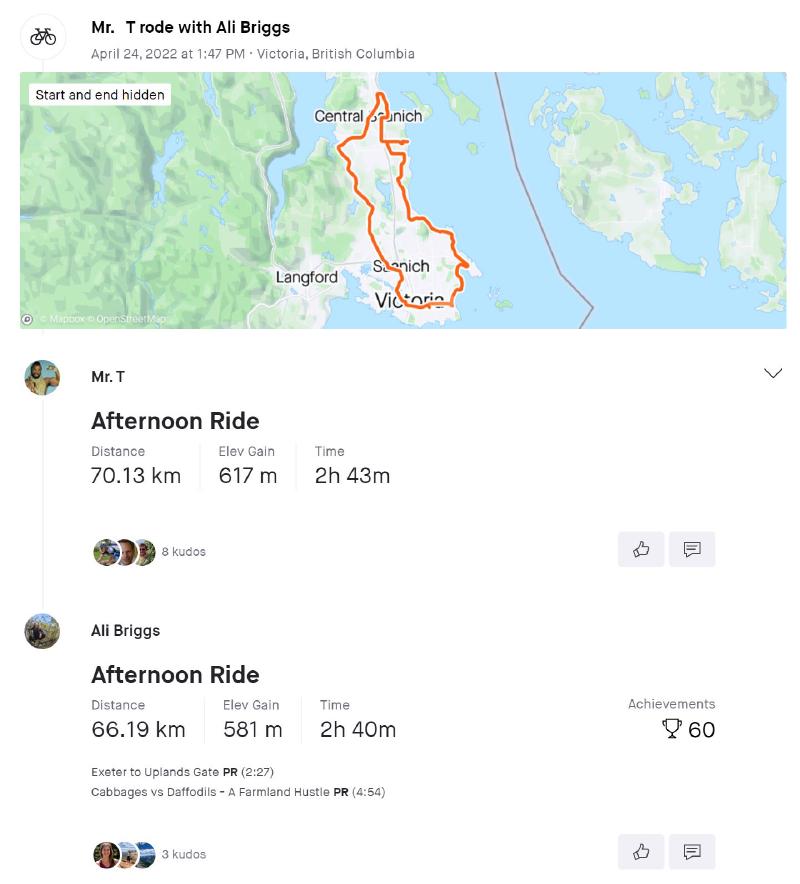
What Strava shows for each activity in the feed.
This seemed like a great starting point as I applied my own experience to why I give kudos I came up with the following features and why they may influence someone to give kudos:
- Activity Name: did they provide an interesting/engaging name or use the standard Strava name (Afternoon Ride, etc.)
- Activity Length/Duration: was this a “long” run or ride, subjective but some common perceptions i.e. 100km/3-4hr ride is generally considered “long”
- Photos Added: seems likely that by seeing more interesting imagery than just the route map would make people more likely to kudo
- Personal Records Achieved: it appears likely that if someone gets more PR’s on an activity people would be more likely to give kudos
- Other Athletes on Activity: seems sensible that if you record an activity with more people, there’s more people connected and likely give you kudos for the shared achievement/experience
- Total Elevation Gain: elevation can be similar to activity length in that if you do a significant amount of elevation, people may be “impressed” and give kudos
Other interesting features I prototyped but didn’t include in this first attempt were:
- Ride in a New Location: if you are traveling away from your home stomping grounds, do you get more kudos?
- Start Time: if you ride in the morning, afternoon or evening, or you upload your ride at a certain time, do you get more kudos due to people checking Strava at similar times?
Now with a (hopefully) good idea of where to start, we need some data to learn from.
EDA: 1400+ Rides, 3800 kudos
The vast majority of my activities are cycling, so I decided to start trying to predict kudos of just cycling activities. This is in part due to some of the features such as Activity Length have very different definitions of “long” when riding vs. running (160km vs. 30km). Likely normalizing different activities by means could work but for now taking the K.I.S.S. approach.
Issue: Strava doesn’t say how many followers you had when you completed an activity
This is important because to generalize a model to any user ideally it predicts what percentage of your followers give kudos.
Not a problem though, I built a linear estimation of my total follower count from when I joined Strava in 2013 to now, 2022. It appears to give a reasonable approximation as seen below by the estimation roughly tracking how my kudos per ride I got over the years.
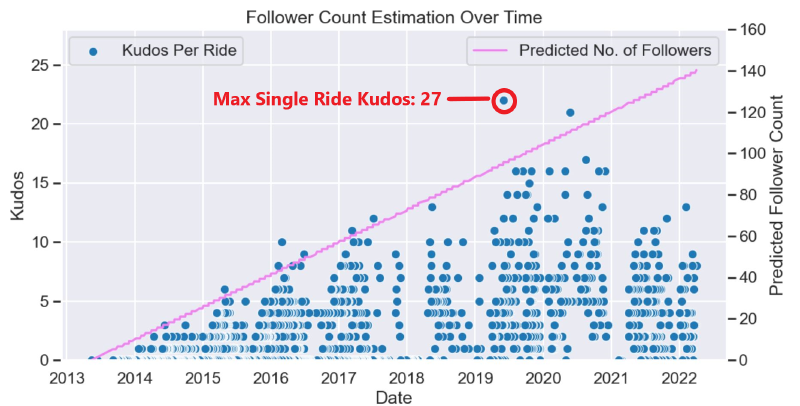
My kudos over the years.
It appears only in the last ~2 years did my kudos/followers likely stagnate and may be quite close to my current ~140 followers. Something to improve with a step-wise estimation but for now I started with the linear estimation.
Turns out people like when you ride 320km!
The most kudos I’ve received, 27, came from December 2019 when I did the (Lake Taupo Cycling Challenge in New Zealand)[https://www.cyclechallenge.com/] which was a 320km road ride in ~11hrs, got some serious kudos!
Target Metric: Percentage of Followers who Kudo’ed (PFK)
This is the kudos per ride divided by number of followers at that time.
Model Development: From Dummy to Production
Taking the now useful PFK field as the target variable, I set to work prototyping some different regression models.
One trick with this data is on any given ride only a small percentage of my TOTAL followers give kudos (e.g. 5-20%).
This means so the Root Mean Squared Error (RMSE) of PFK will appear quite small when in fact they are relatively large.
For example an RMSE of 4% appears pretty good at first glance. But if the model predicts 8% of my followers will give kudos then it means I’ll likely be in the range of 4%-12% of my followers.
For my 140 followers it might be “predicting” I’ll get between 6 - 17 kudos which is quite a wide margin and likely becomes much less useful.
Therefore as a starting point…
Initial RMS Error Target: within 2% PFK
As a baseline I trained two dummy models which just predict the mean/median of all the training data, linear regression, random forest, and XGBoost models. For this prototyping I used a 70/30 train/test split and hyper-parameter tuning with grid search (i.e. try all combinations of a range of parameters).
Typically this not ideal due to the computation time to try each combination of parameters. Ideally I would use a more sophisticated hyper-parameter tuning tool such as Ray Tune but because the data set is quite small each training run for 100+ combinations took less then 20-30s. So iterations were fast enough. After this the plan was to move towards a proper K-Fold cross validation training setup but simplicity was prioritized for this prototyping, K.I.S.S.
All things considered the prototyping produced promising results:
| Baseline Model | Train RMSE (%) |
|---|---|
| Dummy - Mean Prediction | 4.02% |
| Dummy - Median Prediction | 4.10% |
| Linear Regression | 3.05% |
| Random Forest | 2.58% |
| XGBoost | 2.42% |
XGBoost (unsurprisingly) comes out on top, but what features were most important?
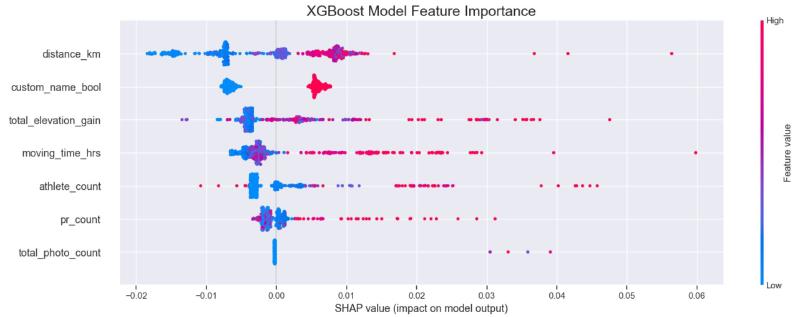
SHAP value feature importance
Similar to above you can see the feature importance increasing at higher values of distance and elevation gain in the following dependence plots.
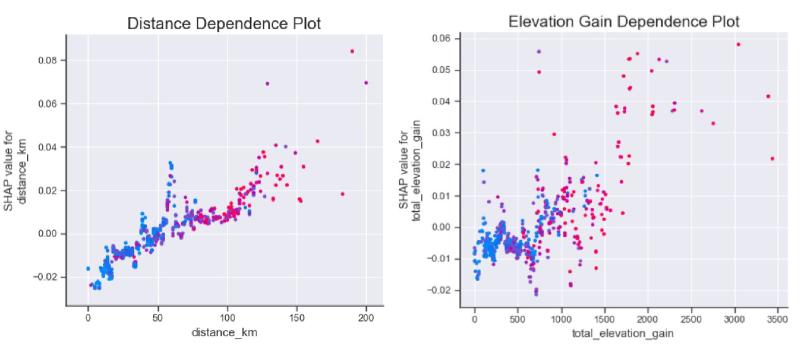
SHAP value feature dependence
After digging into why certain features didn’t perform as expected I learned a couple useful things:
Insight 1: I don’t post photos often, only 19 times over ~9yrs, which explains why photos had so little impact
Insight 2: Balancing school, riding and work meant the majority of my rides were alone so including number of other athletes added little value
Insight 3: It doesn’t appear people pay close attention to your PR’s, you should though!
Final Model Training
With the first attempts looking “good enough” and close to that 2% RMSE target I focused in and selected 4 features to train a final model on:
- Custom Name
- Ride Distance
- Elevation Gain
- Achievements
Using the above 4 features I set about tuning the XGBoost model. To manage over-fitting the data I used 5 fold cross validation and again a 70/30 train-test split. After ~120 different training runs the most performant model in terms of RMSE and R^2 didn’t quite reach the target of 2% but was quite close and the cross validation scores were reasonable:
| Training Set | Test Set | |
|---|---|---|
| RMSE | 1.96% | 2.36% |
| R^2 | 0.764 | 0.642 |
| CV Mean RMSE | 2.94 % | N/A |
| CV StDev RMSE | 0.2% | N/A |
The predicted vs. actual comparison plot below shows there aren’t too many major deviations from diagonal. This gives some confidence the model can work across a wide range of input parameters consistently.
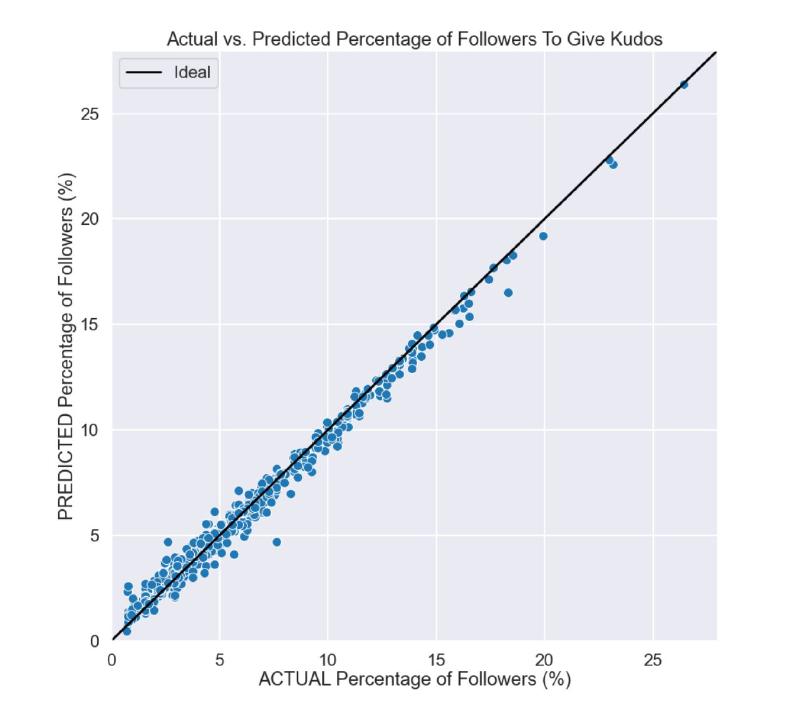
Cross plot of model predictions on training set
I was happy with this performance so now to deploy! All training runs were tracked in a self hosted MLflow instance on Google Cloud Platform. I set it up for the entire Strava Snooper project to track and iterate “Production” models easily and play around with different MLOps approaches.
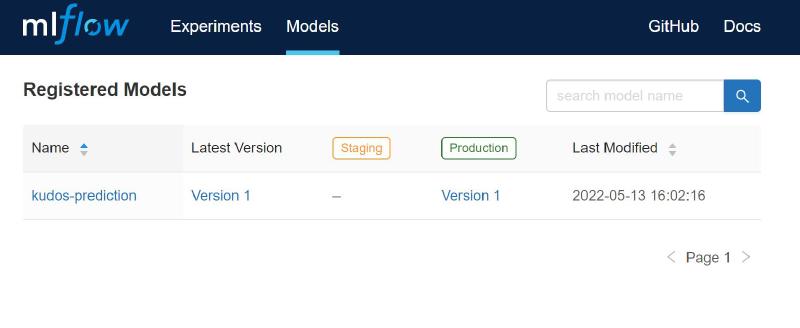
MLflow tracking server
Full details on how I deployed and integrated with the Strava Snooper website using FastAPI and GCP will be for another time, but for now…
Interpretation: How to Increase Engagement & Maximize Kudos on Rides
The most useful/interesting insights I found were:
Insight 1: By giving your ride an engaging name (such as funny rap lyrics like I’ve done in the past) you can get ~15% more kudos, no grueling rides required
Insight 2: Riding longer distances beyond ~70-80k has marginal benefit for your kudos, but ride 180k+ and you could see a 40% increase
Insight 3: If you can climb 1500m+ in your ride you could see up to a 50% increase in kudos
Insight 4: More achievements don’t equal more kudos, if anything they may decrease the number of kudos you get so maybe don’t hunt those KOM’s too hard
There are multiple plateaus and inflection points on how many kudos you get so look below or better yet try out the tool. Hopefully you’ll see where you can maximize your kudos, or perhaps push yourself to get to the next local maxima!
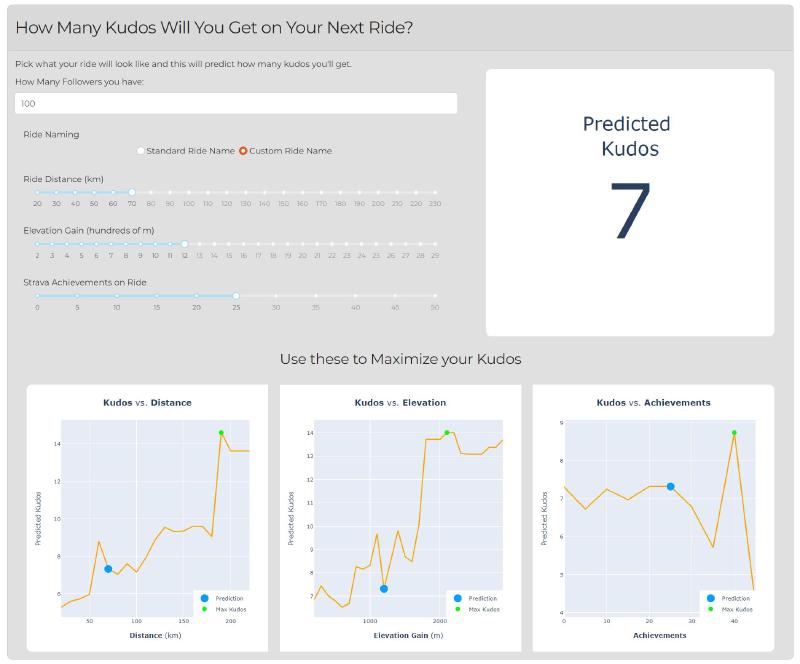
Demo & API: StravaSnooper.com
As hoped the model picked up some useful insights when predicting kudos. There is a live demo of the model and it’s predictions if you follow the link below).
Strava Snooper Kudos Prediction Demo
Should anyone feel the unreasonable desire to use this model to predict kudos I setup a (currently) public API at ml.stravasnooper.com built with FastAPI, dockerized, then deployed to GCP Cloud Run.
Future Improvements
As with all projects, professional or personal, you need to draw the line some where as to what’s “good enough”. That being said these are some things I’d like to improve on this project:
- scraping follower count at the time the activity was recorded would help improve generalization of the model and hopefully accuracy as well
- getting a persons data who posts pictures regularly to incorporate into the model - this is something that has been cited regularly, even by [Strava itself)](https://blog.strava.com/how-to-get-more-kudos-12482/, as a way to increase following, looks like I’ve got a ways to go to maximize my kudos
- including an NLP evaluation of ride titles to learn what gets the best response - do rap lyrics work for everyone? Motivational quotes? Does saying “I won” in a title give immediate kudos? A bag of words model incorporated into the pipeline could give some interesting insights into what works best
- for rides with photos, running object detection/classification across them to include whether photos of people, landscapes, or coffee get more kudos - processing posted photos to figure out what people like and don’t like to see would be interesting, do we really need more Zwift screenshots in our life?
Thanks for reading! Don’t forget to subscribe below for new content delivered straight to your inbox.